Welcome to California Water Watch! This site offers the most current local and statewide water conditions down to your region and even your neighborhood.
This information is updated dynamically from a variety of data sources. Everyone is welcome to research, learn, and stay
informed about California's most precious resource -- water.
California Water Watch offers the most current local and statewide water conditions down to your region and even your neighborhood.
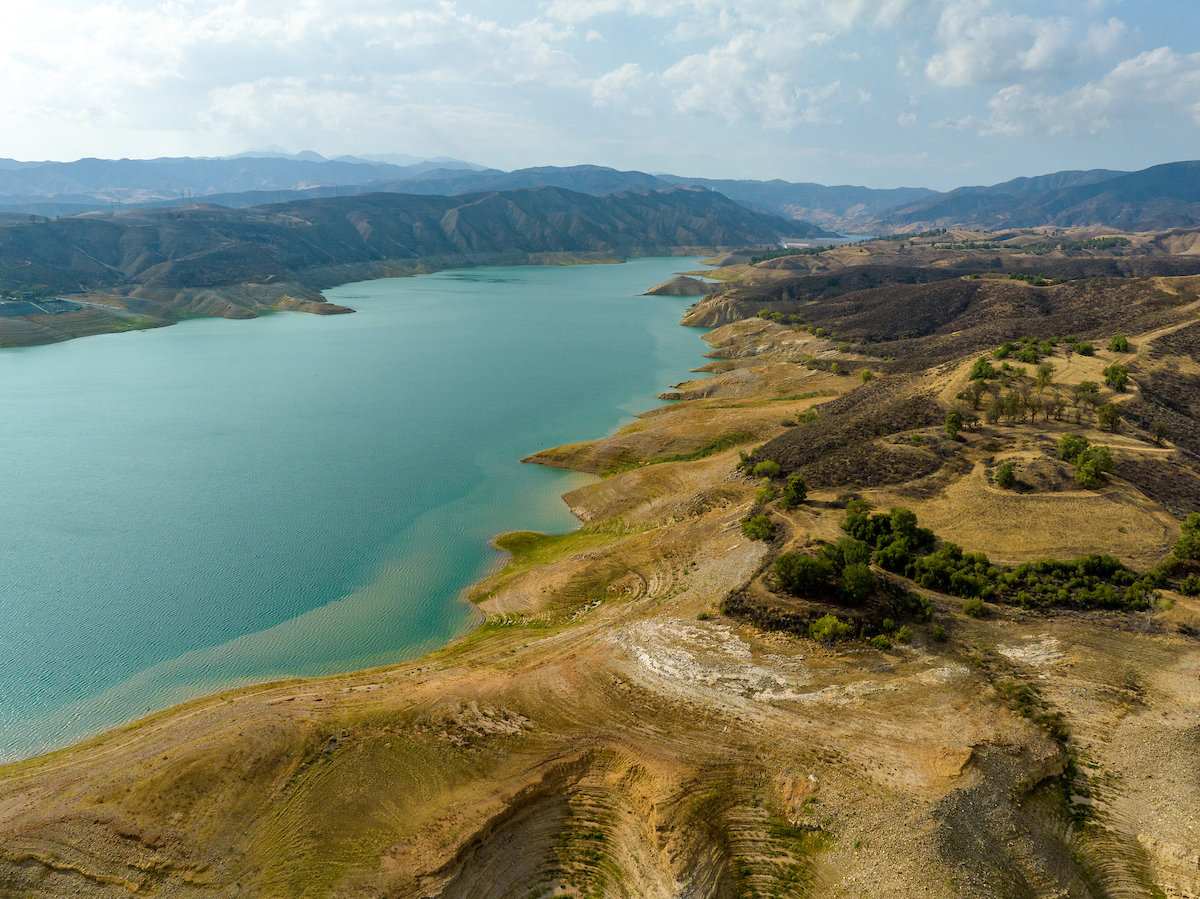
A drone view of Bidwell Bar Bridge at Lake Oroville in Butte County, California. Photo taken March 11, 2025.
Tracking Precipitation Status
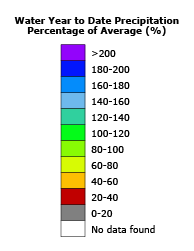
Water Year to Date Precipitation Percentage of Average (%) - 07/04/2025
Precipitation data shown here are Parameter-elevation Regressions on Independent Slopes Model (PRISM) data acquired via a licensing agreement with Oregon State University. For more information on this dataset see: https://prism.oregonstate.edu/
Tracking Current Weather Conditions
Climate change has fundamentally altered our state’s hydrologic system – intensifying severe weather as we swing from extreme dry to extreme wet situations.
The outlook for water year 2025 is still uncertain and La Niña is not the sole driver of how wet this year will turn out. It’s important to carefully manage reservoirs during the uncertainty of future weather patterns and the possibility of extreme wet or dry conditions.
Extensive coordination with State and Federal agencies is being done, to both ensure reservoirs have flood space in case of another flood year and that as much water as possible will be stored in case of drought conditions.
We will continue to work closely with the research community through partnerships with Scripps/NOAA/others to understand climate forces and continually improve our forecasting.
In drier seasons, we rely on other sources of water.
These include reservoirs and melted snowpack.
But climate change is causing extreme weather and changing the amount of rain and snow we get,
impacting how we are able to capture and distribute water.
Californians must adapt to this new normal and adopt conservation as a way of life to make the most out of our limited water supplies across the state.
Major reservoir levels
Reservoirs get us through the dry months
Summary of current level
of average levels
Total capacity
Average level historically
Current level
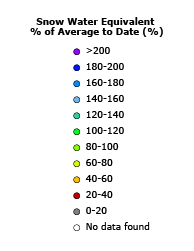
Statewide snowpack levels
Snow melt feeds our reservoirs & rivers
of average peak snowpack
Average peak snow water equivalent from 1991-2020
Current snow water equivalent
What about our groundwater supply?
Groundwater is a vital resource in California and accounts for
almost 60 percent of our State's water supply in drought years.
Multiple dry and drought years over recent decades have put a strain on California's groundwater resources. The data on the right show the number of monitoring wells that have water levels below average and the number of well outages across the state voluntarily reported to DWR.
Visit California Groundwater Live for more real-time groundwater information.
California’s annual precipitation can vary greatly from year to year and region to region. The map of California shows how this water year’s precipitation compares to what has been observed historically. The chart below provides a summary of California’s current statewide precipitation statistics.
Precipitation Statistics (period of record: 1981-current)
Statewide as of 07/04/2025
Water Year to Date:
% of Average:
Precipitation % of average for full water year through September 30th:
Historical Record to Date:
Max:
Mean:
Min:
Percent of Average Precipitation (%)
Percent of State (%)
0-19
20-39
40-59
60-79
80-99
100-119
120-139
140-159
160-179
180-199
>= 200
California’s new Water Year began Oct. 1, 2024 and ends Sept. 30, 2025. Graphics on this site use data for WY 2024-25. To view WY 2023-24 data, visit the yearly summary page.
*Updated daily at 1 pm from the prior day, as data is made available.
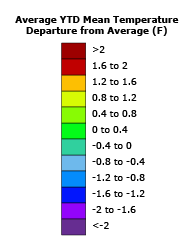
Temperature as of 07/04/2025*
Temperature plays a large role in California’s annual water conditions. Higher than normal
temperatures present several challenges to managing the state’s water supply. The map of California shows
how this year’s temperatures compare to what has been observed historically.
California’s new Water Year began Oct. 1, 2024 and ends Sept. 30, 2025. Graphics on this site use data for WY 2024-25. To view WY 2023-24 data, visit the yearly summary page.
*Updated daily at 1 pm from the prior day, as data is made available.
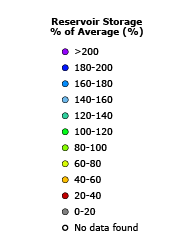
Reservoirs as of 07/04/2025
The map of California shows how reservoir conditions compare to their historical averages for this month. The metrics below are an estimate of the current total statewide reservoir storage.
Estimated Total Statewide Reservoir Storage:13.6 MAF*
Percent of Historical Average:68%
*Million Acre Feet (MAF). On average, California receives about 200 million acre-feet of water per year in the form of rain and snow. One acre-foot of water is enough to serve two families of four for a year.
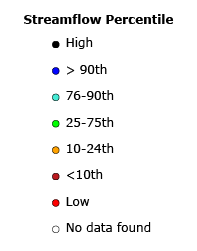
Streamflow as of 07/04/2025
The map of California shows how real-time streamflow at gaged locations compares to historical streamflow ranges for the same day of the year.
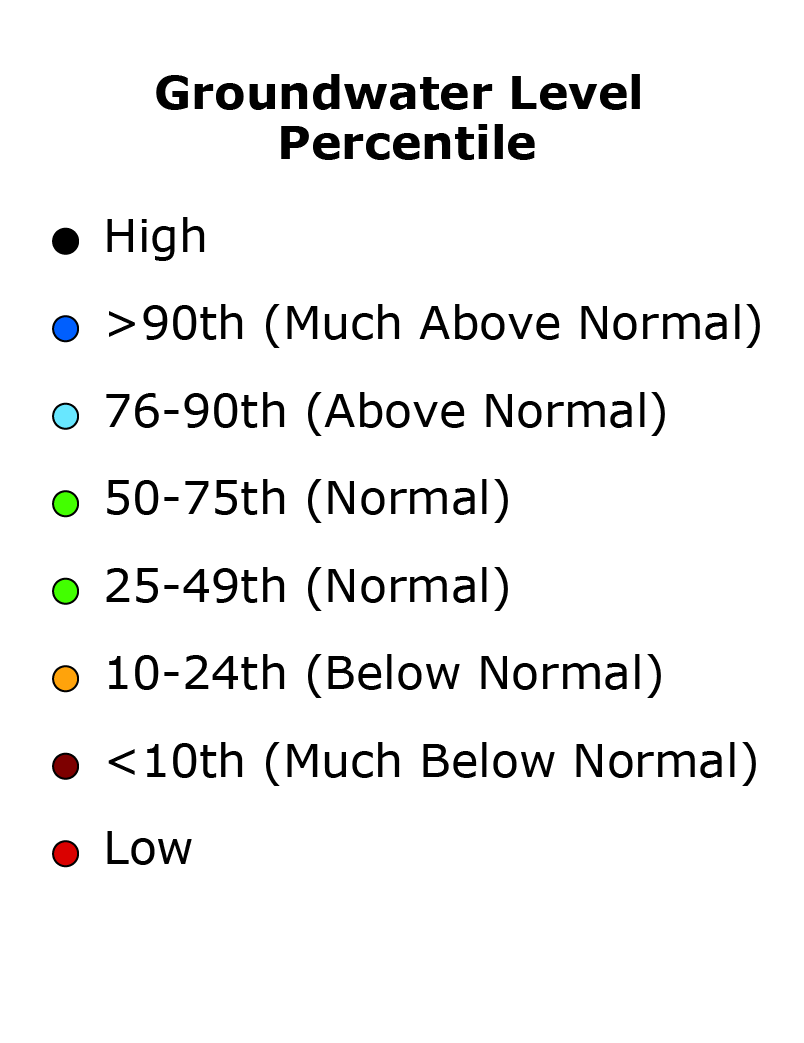
Groundwater as of
The map of California shows groundwater level conditions across the state by comparing the most recent groundwater level measurement at individual monitoring wells to historical measurements during the same month. For a well to appear on this map, the most recent measurement must have occurred within the last 18 months, and measurements from at least 10 years must exist for that month.
Currently, most monitoring wells are only measured twice a year, in the spring and fall. Few wells have monthly data, however the State and local groundwater monitoring agencies are working to improve and expand groundwater level data collection.
We are collectively learning more than ever before about our groundwater basins from data being collected and reported by local groundwater agencies. These data are the foundation to support future decision-making related to land use and water resource planning.
The State and locals will continue monitoring and tracking groundwater conditions and collecting new data allowing locals to better manage water resources including implementing groundwater recharge during average and wet years to ensure groundwater will be available as a buffer for future dry and drought times when it is needed most.
Snowpack as of 07/04/2025
The map of California shows how snowpack conditions compare to the historical averages at various locations across the state.
The plot below aggregates this same data to show how the cumulative statewide snowpack is tracking relative to the historical average.
This allows us to see how well the snowpack is doing to date, as well as how much snow may still be needed to reach the average peak snowpack (i.e., April 1st snowpack)
Percent of normal to date:
Percent of April 1st average:
California’s new Water Year began Oct. 1, 2024 and ends Sept. 30, 2025. Graphics on this site use data for WY 2024-25. To view WY 2023-24 data, visit the yearly summary page.
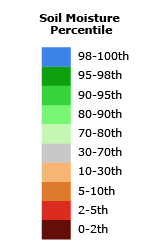
Soil Moisture as of 12/31/2024
This map shows relative values of estimated soil moisture at a depth of 100 cm, as calculated from satellite-based observations.
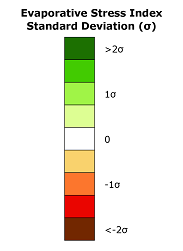
Vegetation Conditions as of 07/04/2025
The map of California depicts vegetation conditions across the state based on the Evaporative Stress Index (ESI).
ESI provides insight on how stressed vegetation is due to a lack of water, which is expressed as the statistical variation from average conditions.
California’s annual precipitation can vary greatly from year to year and region to region. The map of California shows how this water year’s precipitation compares to what has been observed historically. The chart below provides a summary of California’s current statewide precipitation statistics.
Precipitation Statistics (period of record: 1981-current)
Statewide as of 07/04/2025
Water Year to Date:
% of Average:
Precipitation % of average for full water year through September 30th:
Historical Record to Date:
Max:
Mean:
Min:
Percent of Average Precipitation (%)
Percent of State (%)
0-19
20-39
40-59
60-79
80-99
100-119
120-139
140-159
160-179
180-199
>= 200
Snowpack as of 07/04/2025
The map of California shows how snowpack conditions compare to the historical averages at various locations across the state.
The plot below aggregates this same data to show how the cumulative statewide snowpack is tracking relative to the historical average.
This allows us to see how well the snowpack is doing to date, as well as how much snow may still be needed to reach the average peak snowpack (i.e., April 1st snowpack)
Percent of normal to date:
Percent of April 1st average:
Reservoirs as of 07/04/2025
The map of California shows how reservoir conditions compare to their historical averages for this month. The metrics below are an estimate of the current total statewide reservoir storage.
Estimated Total Statewide Reservoir Storage:13.6 MAF*
Percent of Historical Average:68%
*Million Acre Feet (MAF). On average, California receives about 200 million acre-feet of water per year in the form of rain and snow. One acre-foot of water is enough to serve two families of four for a year.
Groundwater as of
The map of California shows groundwater level conditions across the state by comparing the most recent measurements
at wells to the previous 10 years of measurements for the wells. Most wells are only measured twice a year, in the spring and fall. Few wells have monthly data.
Temperature as of 07/04/2025
Temperature plays a large role in California’s annual water conditions. Higher than normal
temperatures present several challenges to managing the state’s water supply. The map of California shows
how this year’s temperatures compare to what has been observed historically.
Streamflow as of 07/04/2025
The map of California shows how real-time streamflow at gaged locations compares to historical streamflow ranges for the same day of the year.
Soil Moisture as of 12/31/2024
This map shows relative values of estimated soil moisture at a depth of 100 cm, as calculated from satellite-based observations.
Vegetation Conditions as of 07/04/2025
The map of California depicts vegetation conditions across the state based on the Evaporative Stress Index (ESI).
ESI provides insight on how stressed vegetation is due to a lack of water, which is expressed as the statistical variation from average conditions.


 Precipitation
 Snowpack
 Reservoirs
 Groundwater
 Temperature
 Streamflow
 Soil Moisture
 Vegetation