How is Water Used in California and Where Does My Water Come From?
Water Use in California
Water use by type
Urban
Agricultural
Environmental
11%
42%
47%
(average over 1998-2016)
Water use percentage by source
Data source: California Water Plan Update
| Surface water | Groundwater | Other | |
|---|---|---|---|
| Urban | 55 | 41 | 4 |
| Agricultural | 53 | 42 | 5 |
| Environmental | 74 | 1 | 25 |
(average over 1998-2016, less 1998, 2000-2001)
Data source: California Water Plan Update
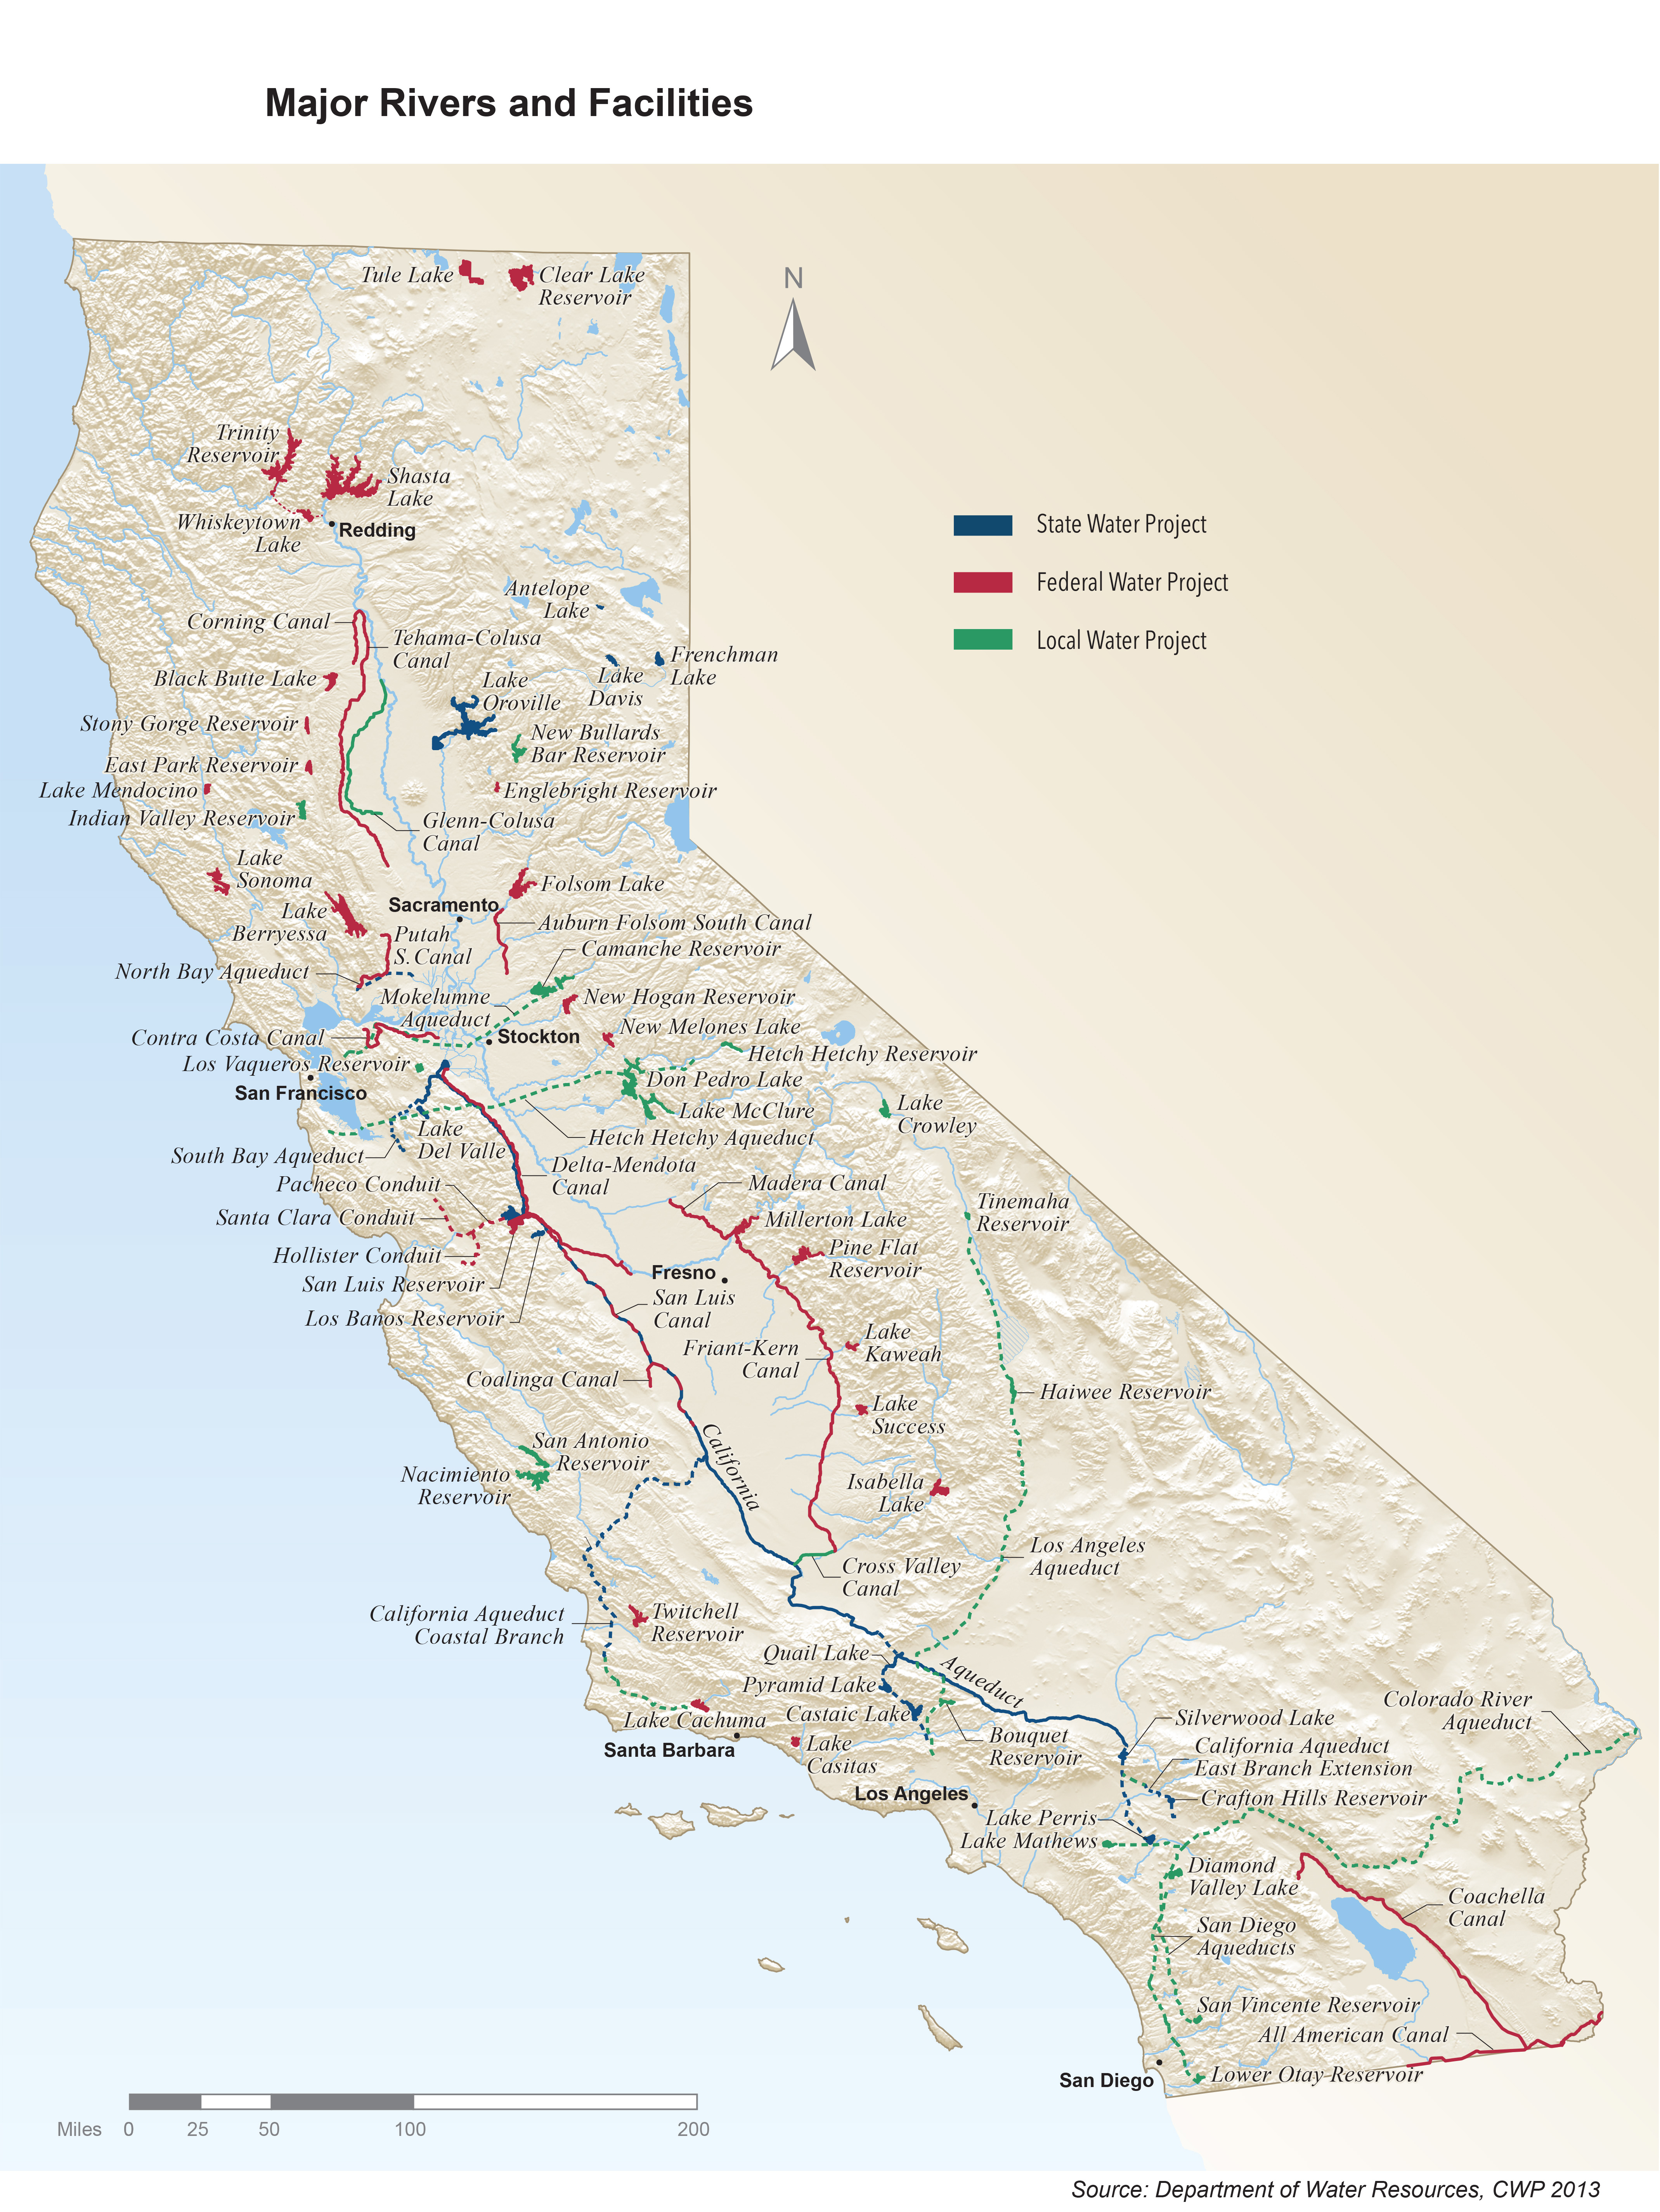
California has an extensive system of federal, state, and local water infrastructure for managing surface water and transporting it to the places where it is used (see map below). Groundwater, whether by itself or in conjunction with surface water, supports many public water systems and most small ones (systems that supply drinking water to residents).
If your drinking water is supplied by a public water system you can use the watershed page to identify the water provider serving your area and
find its website for more information about where the provider obtains its water supply.
Additional information about water use in California is available from work performed for DWR’s California Water Plan Update.