Track California Water Conditions
View Local Water Conditions
Search on Map
View
Tracking Precipitation Status
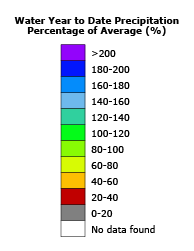
Water Year to Date Precipitation Percentage of Average (%) - 01/25/2026
Tracking Current Weather Conditions
Climate change has fundamentally altered our state’s hydrologic system – intensifying severe weather as we swing from extreme dry to extreme wet situations. The outlook for water year 2026 may very well be a variation of water year 2025. With La Niña still influencing California’s climate, it could be a highly variable year with many opportunities for extreme weather events. It is quite possible California will have a drier than average winter in the southern part of the state and a near or above average winter in the north. One set of strong storms or atmospheric rivers can make the difference between wet and dry. It’s important to carefully manage reservoirs during the uncertainty of future weather patterns and the possibility of extreme wet or dry conditions.
Extensive coordination with State and Federal agencies is being done, to both ensure reservoirs have flood space in case of another flood year and that as much water as possible will be stored in case of drought conditions.
We will continue to work closely with the research community through partnerships with Scripps/NOAA/others to understand climate forces and continually improve our forecasting.
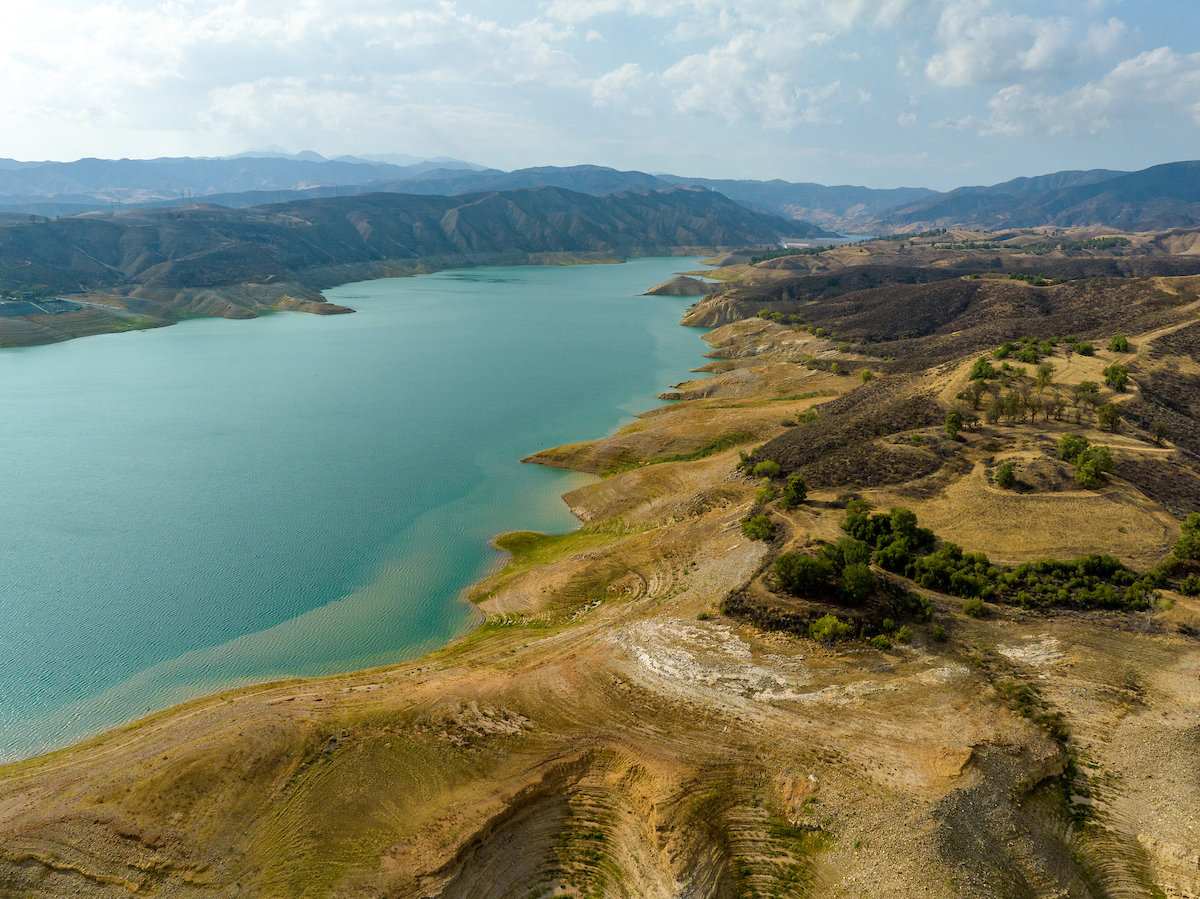
Do we have enough water stored?
In drier seasons, we rely on other sources of water. These include reservoirs and melted snowpack. But climate change is causing extreme weather and changing the amount of rain and snow we get, impacting how we are able to capture and distribute water.
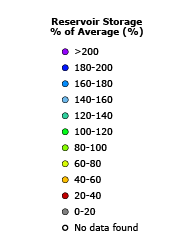
Major reservoir levels
Reservoirs get us through the dry months
of average levels
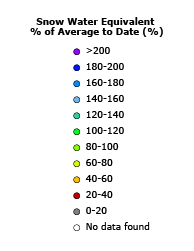
Statewide snowpack levels
Snow melt feeds our reservoirs & rivers
from 1991-2020
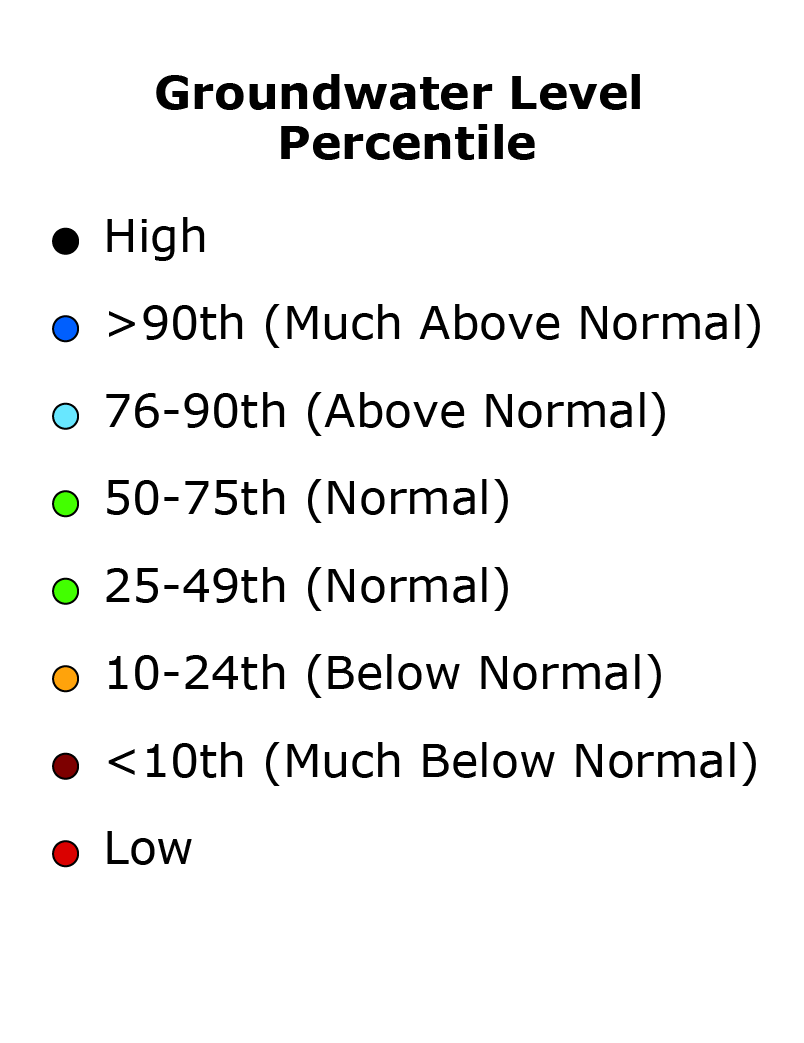
What about our groundwater supply?
Monitoring Wells
Below Normal Level
Dry Wells Reported - Water Year to Date
 Precipitation
 Snowpack
 Reservoirs
 Groundwater
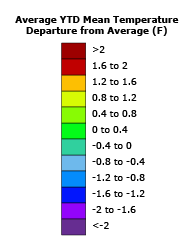
 Temperature
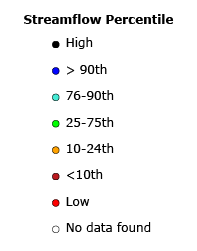
 Streamflow
 Soil Moisture
 Vegetation
Precipitation as of 01/25/2026*
California’s annual precipitation can vary greatly from year to year and region to region. The map of California shows how this water year’s precipitation compares to what has been observed historically. The chart below provides a summary of California’s current statewide precipitation statistics.
*Updated daily at 1 pm from the prior day, as data is made available.